One particularly useful feature in the NinjaTrader app is the ability to add multiple instruments to a single chart panel. This allows traders to simultaneously view and analyze the price action of different instruments, facilitating correlation studies, comparative analysis, or multi-asset strategies—all within a unified interface.
Note
By combining multiple instruments in one chart panel, you can:
Compare price movements: Identify trends, divergences, or correlations between markets.
Overlay instruments: Visualize two or more instruments on the same price scale for direct comparison.
Enhance analysis: Use custom indicators across multiple instruments for deeper insights.
In the following steps, we’ll walk through how to add multiple instruments to a chart panel in NinjaTrader, ensuring you can maximize this functionality to enhance your trading workflow.
Note
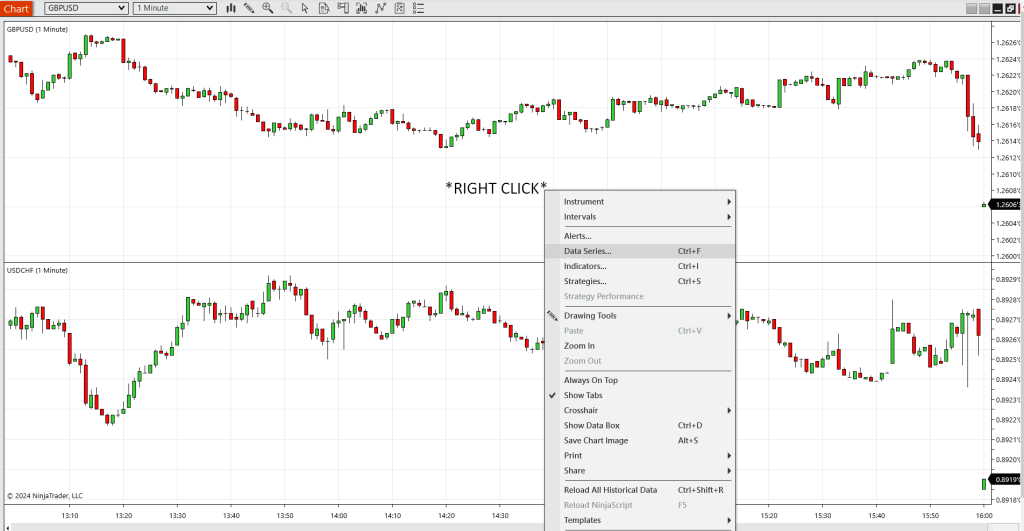
- First you open your NinjaTrader app. Start with the RIGHT CLICK on the panel and
go to DATA SERIES: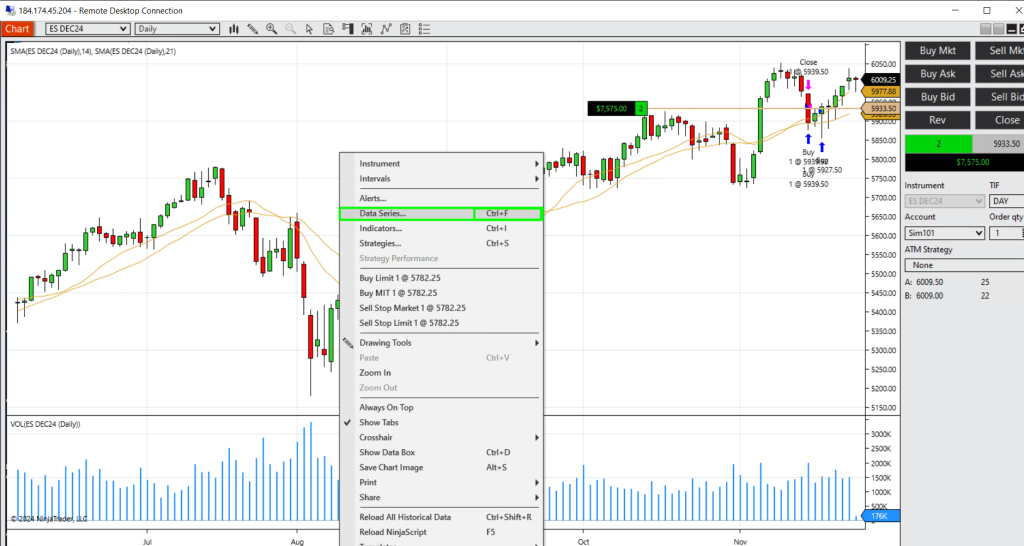
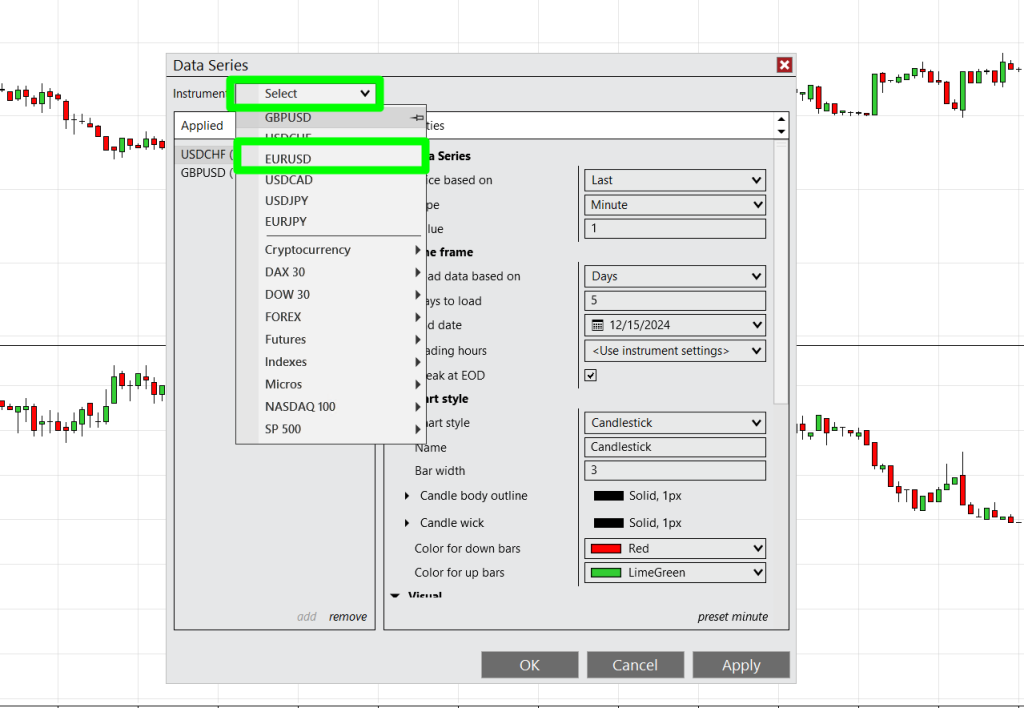
- Once you’re in DATA SERIES, you should pick an instrument you’d like to add on the top of the little window (In our case GBPCAD)
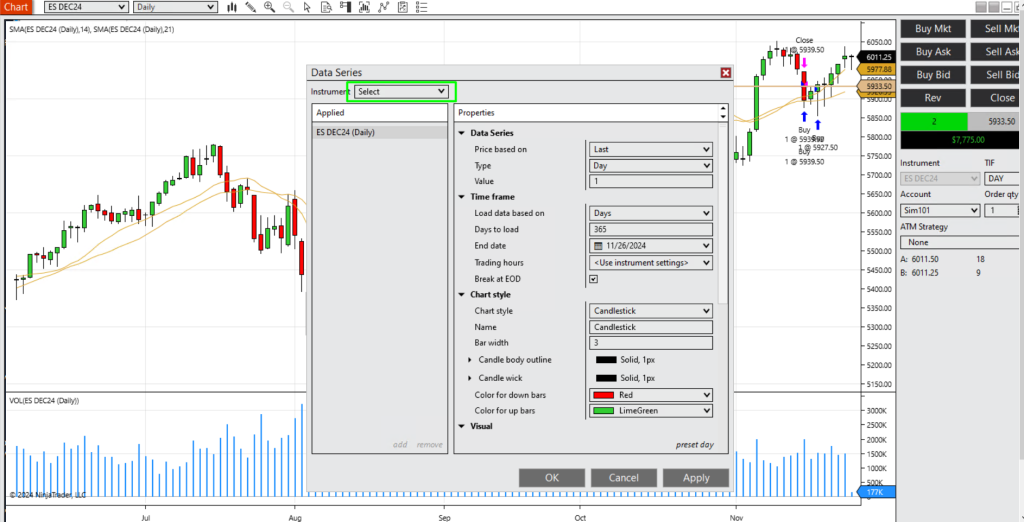
- Select the INSTRUMENT you’d like to add from the drop-down menu and you will see that it will show up as the NEW PANEL:
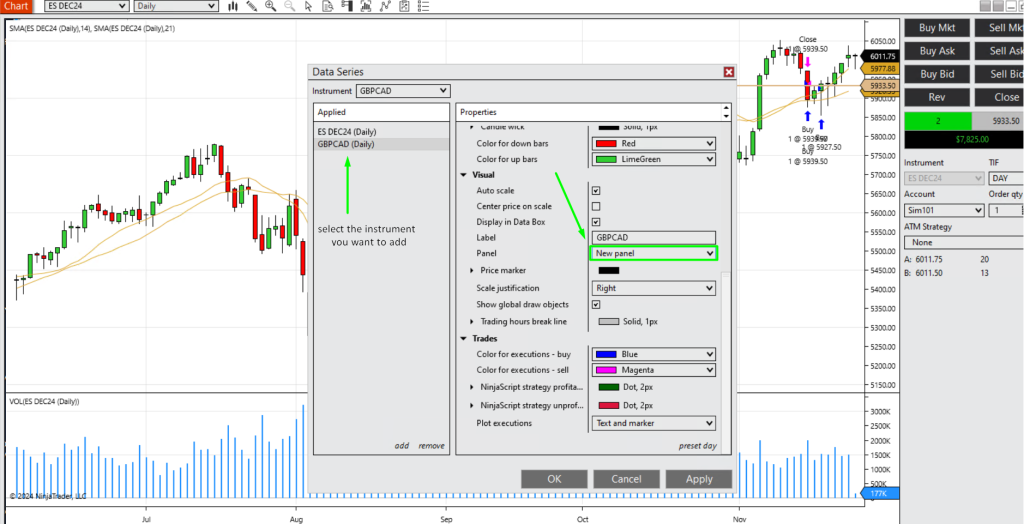
- Click on APPLY and it will show up in your existing CHART PANEL, so you can follow two instruments at the same time and/or compare the prices in the real time.
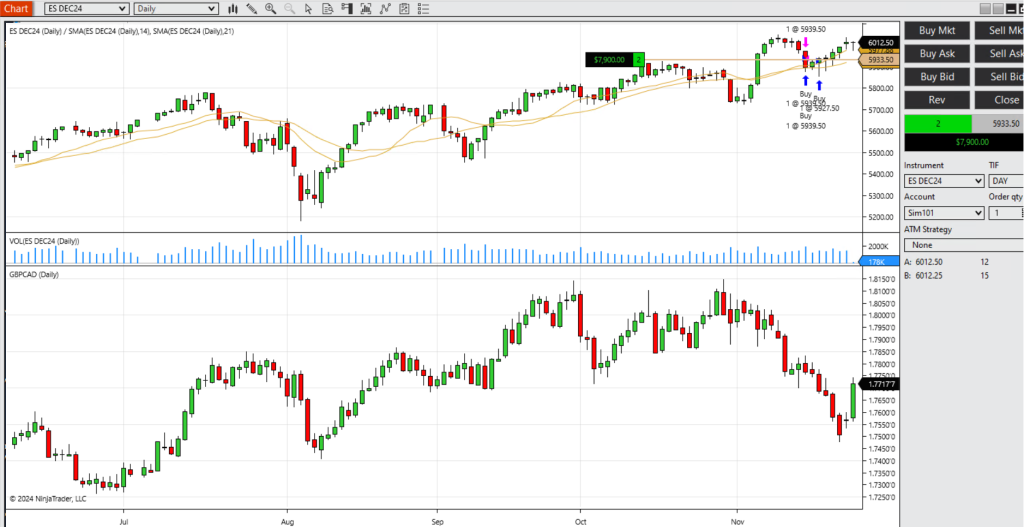
- You can customize the panels dimensions by clicking on the MIDDLE LINE that separates your two instruments and resize the one you want to:
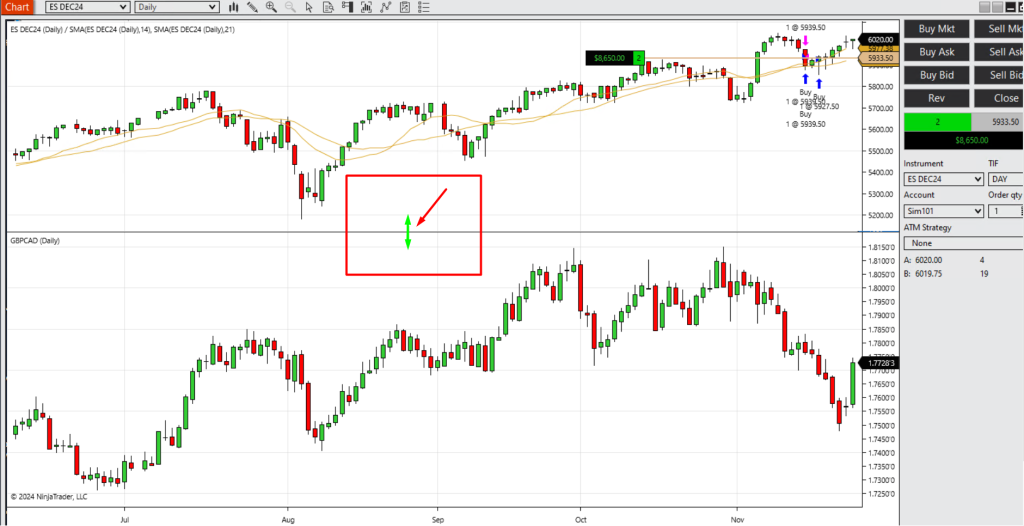
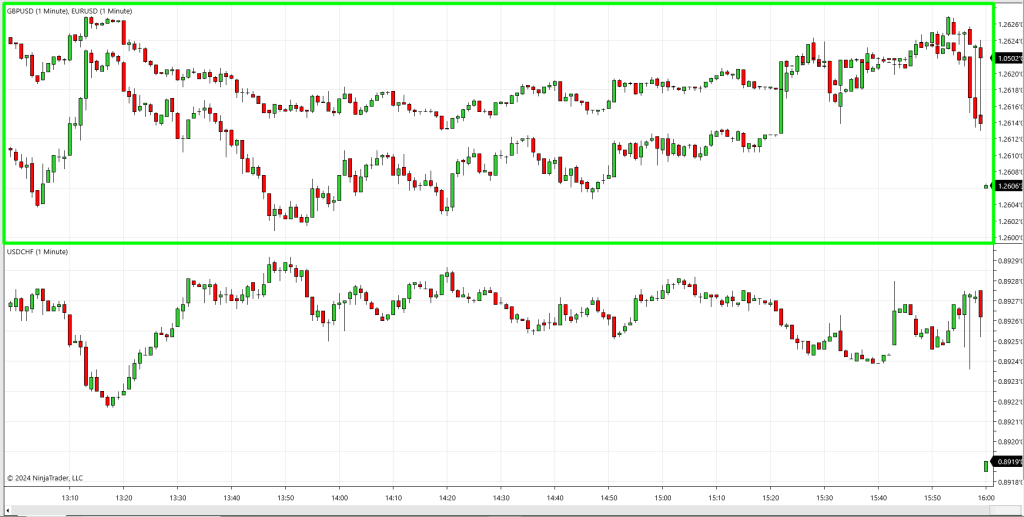
And you can also create a single panel with multiple instruments in order to better gauge relative magnitude of the move
Note
- Start with RIGHT CLICK on the panel you want to add instrument on and go to DATA SERIES:
- Then, just like before, select the instrument you’d like to add (EURUSD in our case):
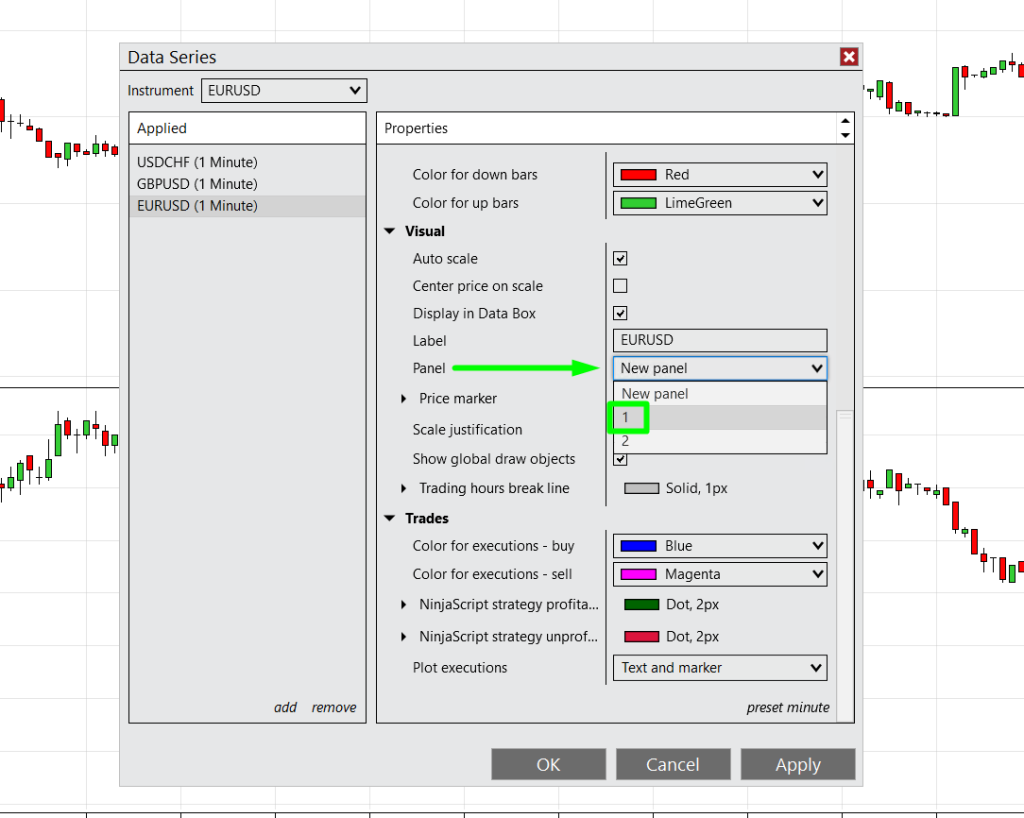
- Then make sure you select the PANEL where you want to add the INSTRUMENT to:
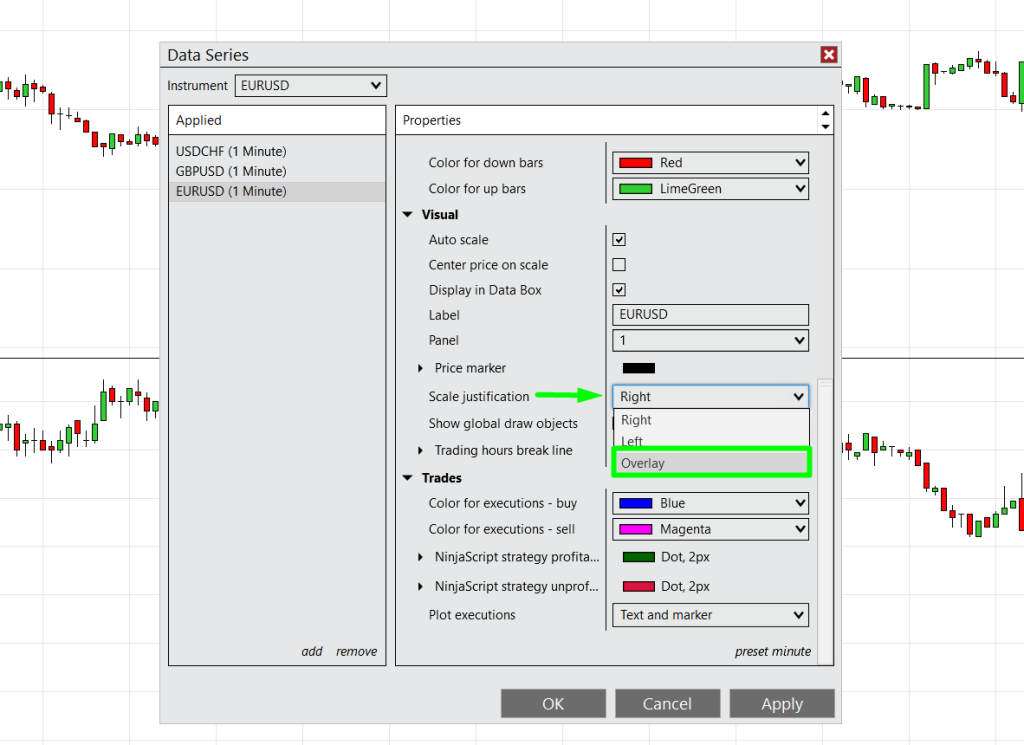
- Make sure to set SCALE JUSTIFICATION to OVERLAY:
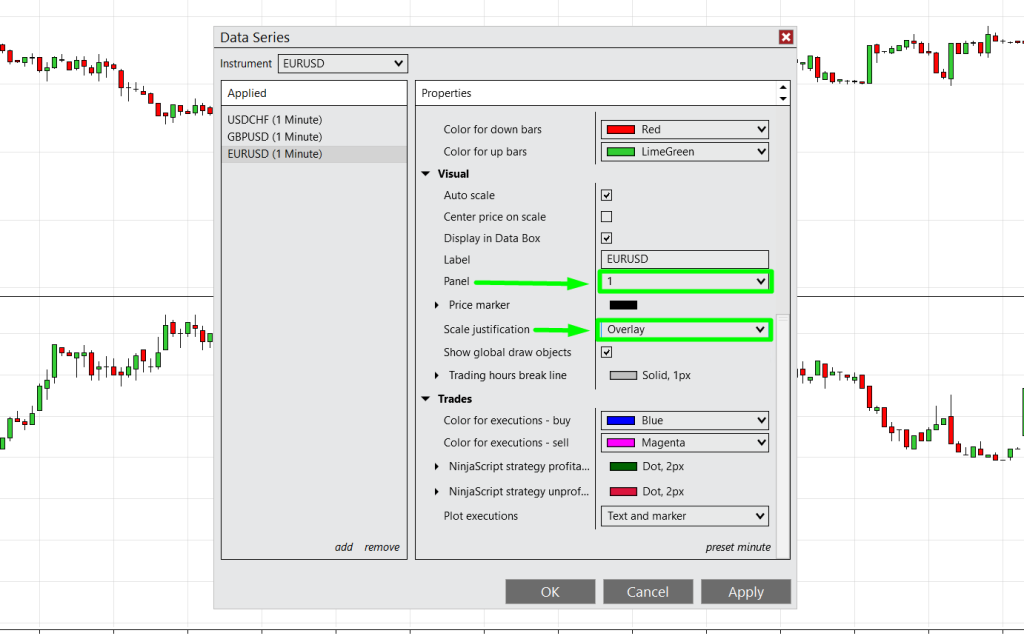
- Check if PANEL and SCALE JUSTIFICATION are set and click APPLY:
- Then the CHART will appear in the SELECTED PANEL like this: